Bang & Clean blast cleaning for industrial boilers
Demolition of residential buildings in Jakomäki
Cleaning work and water jet cutting during major stoppage at Neste Oil
Demolition work at the Olympic stadium
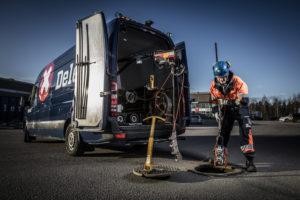
Sewer imaging in Osuuspankki property, Simo
Urban demolition at Kasarmitori square, Helsinki
Indoor demolition work at Dipoli
Water management at the first geothermal heating plant worksite in Finland
Cleaning the tanks of Silja Serenade
Demolition of Koverhar steel factory